The Pie Charts Show The Results Of A Survey In Which Undergraduates And Postgraduates Were Asked About The Range Of Books In Their Library
Model Answer
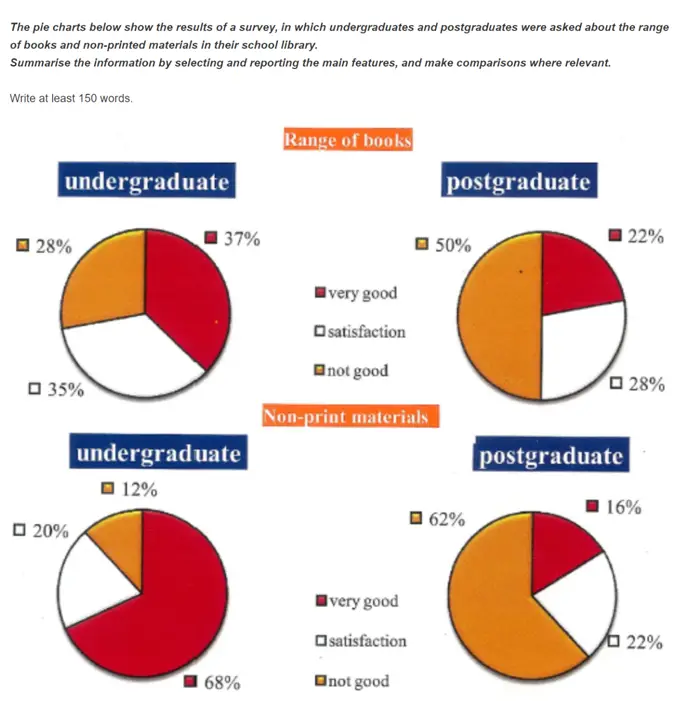
The pie charts show how undergraduates and postgraduates rated the range of printed and non-print materials in their library. The majority of undergraduates rated both books and non-print material as very good whereas the majority of postgraduates rated them as not good. While 37% of undergraduates gave good rating to the range of books and other printed materials, 35% of them said that they were satisfied. However, 28% of undergraduates were not happy with the range of the printed material in their library. As for the ratings of non-print materials, an overwhelming majority of undergraduates (68%) rated them very good. While 20% of them said they were satisfied with the non-print materials, 12% thought they were not good.
Post graduates had a totally opposite view. As much as 50% of them rated the print materials as not good while only 22% thought that they were very good. The remaining 28% of them thought the range of books in their library was satisfactory. Their rating of non-print materials was even worse. While 62% of them rated the non-print materials as not good, only 16% of them thought they were very good. The remaining 22% of them said they were satisfied with the range of non-print materials in their library.
Need help with IELTS writing? Get your essays, letters and reports corrected by me.
How to go about writing your task 1 report
Use appropriate style and tone. Task 1 Academic reports should be written in a formal and impersonal style. Write all verb forms in full. Do not use contracted forms like can’t or shouldn’t. Likewise, do not use abbreviations. For example, write information instead of info.
While writing your task 1 report, resist the temptation to volunteer information you were not asked for. You only have to report the visual information in your own words. You should not offer an opinion or make speculations. Likewise, you do not have to describe every single change shown in the chart or diagram. Just mention the overall trends.
Do you have a report on this topic? Submit it below in the comments for a free band score estimate.