The Graph Shows The Number Of University Graduates In Canada From 1992 To 2007
You should spend about 20 minutes on this task.
IELTS report sample
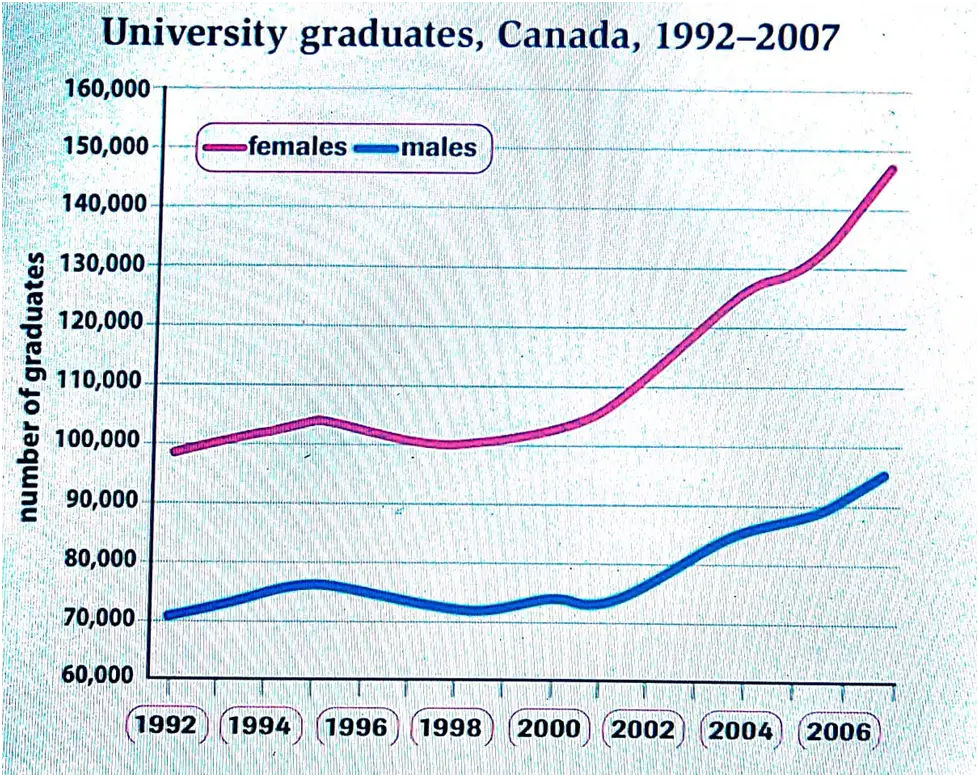
The line graph shows the number of male and female graduates in Canada between the years1992 and 2007. Overall , it is evident that the number of female graduates was considerably higher than the number of male graduates. It can also be seen that there was a gradual increase in the number of both men and women pursuing higher education. To begin with, there were nearly 100,000 female graduates in 1992. This number increased gradually until 1995 and then it dropped slightly before picking up again in the year 2000. Afterwards, there was a dramatic increase in the number of female graduates and in the year 2006, their number was close to 150,000. The same trend can be observed in the case of male graduates. There were about 70,000 male graduates in 1992. This number increased gradually over the next three years, and in 1995, there were about 76,000 male graduates. Afterwards, there was a gradual drop in the number of men pursuing graduation. Their numbers started increasing from year 2002 and by 2006, there were close to 97,000 male graduates.
Need help with IELTS writing? Get your essays, letters and reports corrected by me.