Recycling Rate For Selected Materials | Band 8 IELTS Report

The given graph shows recycling rate for selected materials. Write a report.

Here is a band 8 IELTS task 1 academic report on this topic. Need help with IELTS writing? Get your IELTS reports, letters and essays corrected by me.

Band 8 Task 1 Academic IELTS report

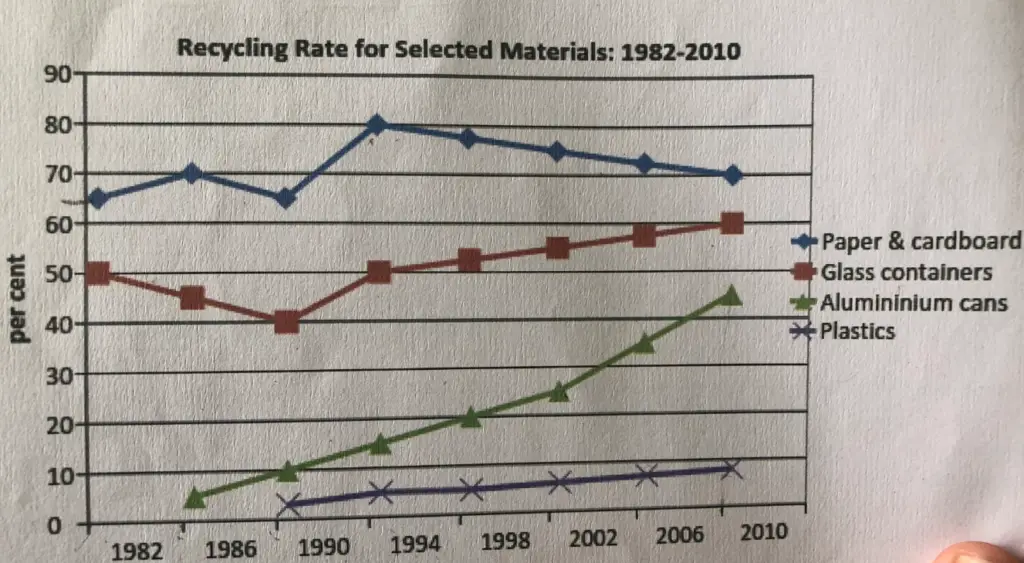
The graph shows information about the percentage of four different materials recycled in a country over a period of 28 years between 1982 and 2010. Overall, what stands out from the graph is that the recycling of aluminium cans showed an upward trend throughout the period. Another interesting point to note is that paper was the most recycled item throughout the whole period. 65% of paper and cardboard was recycled in 1982. This figure increased slightly over the next four years and then kept fluctuating until 1990. In 1994 as much as 80% of this item was recycled. Afterwards this quantity decreased gradually to 70% in 2010. The recycling of glass containers showed a similar trend. While in 1982, 50% of them were recycled, this figure declined over the next 8 years to 40%. Afterwards, the recycling of glass containers again picked up and in 2010 as much as 60% of them were recycled. The recycling of aluminium cans began in 1986.While only about 5% of them were recycled in that year, they picked up pace over the years and in 2010 almost 45% of the aluminium cans were recycled.   Plastic recycling began in 1990 and it remained the least recycled item (less than 10%) throughout the given period.

Do you have a report on this topic? Submit it below in the comments for a free band score estimate.

Manjusha Nambiar

Hi, I'm Manjusha. This is my blog where I give IELTS preparation tips.

11 Responses

  1. dikshya says:

    The given line graph depicts the information regarding the recycling rate of the different materials over a period of time from 1982 to 2010. The recycled materials are plastic and cardboard, glass containers, aluminium cans and plastics.
    The study shows, most recycled items are paper and cardboard and plastic beings the least. There was fluctuation in the recycling rate of paper and cardboard with rise and fall trend until 1990 ( maximum up to 80% in 1990). After 1990, although they are reused most, there was gradual decline in their recycling rate. Similarly less glass containers were recycled in the earlier years until 1986, the rate dropping from 50% to 40%. But, then the percentage of recycling spurt and was continuously being reused. The aluminium cans were increasingly recycled and the rate rose form ~5% to 45%.
    Recycling of plastics started from 1990 without significant increase in the rate and thus are least reused.

  2. TSW says:

    All of the materials in the world are changing and recycling. By looking at this graph, recycling rate of paper and cardboard, glass containers, aluminium cans and plastics can be seen.
    In 1982,human beings recycled paper and cardboard almost 65%. After three years, the rate of recycling it was increased to 5%. In 1990, recycling rate decreased.Finally, in 2010, people in a particular country recycled it to 70%. As the next one, glass containers were recycled and decreased to 10% in 1990.However,in the late years, people could gradually increased their recycling rates.
    On the other hand, Aluminium cans and plastics gradually climed up the recycling rate by seeing the graph.In 2010, the rate of aluminium cans incresed.Likewise, plastics were increased to 9% in 2010 comparing to 1990.
    All in All, as the time was gone by, the recycling rates of four materials could gradually increased.

  3. david says:

    your answers too poor.

  4. Nirajan says:

    The graph gives information about the percentage of the four different materials that were reprocessed between 1982 and 2010 in a country.

    Overall, paper and cardboard was the highest recycled materials among all four materials, but this category experienced a slight decline after 1994. Other recycled materials had an increasing trend.

    In 1982, about 65% of paper and cardboard was recycled. There was a slight decrease in recycling rates ultimately reaching 80% in 1994. Afterward, the materials experienced a decrease in rates to 70% in 2010.

    Glass containers in 1982 had 50% recycling rates which decreased by 10% in the following eight years. From 1986, the glass recycling rate increased by 20%, ultimately reaching 60% in 2010. Aluminum cans recycling started in 1986 and showed an increasing trend of reaching 45% over the end of the year 2010. The plastics recycling trend came into practice in 1990 and had constant growth reaching 2% to 8% over the period.

  5. ensi says:

    The line graph compares the percentages of four types of reprocessed goods that have been produced from 1982 to 2010 in one country. The materials include paper and cardboard, glass containers, aluminium cans, and plastics.

    Overall, it is clear that the ranking of proportion of all materials does not change over the period given. Despite this, there are some variances of development. Paper and cardboard experienced more fluctuations than others, while aluminium cans have a big rise and narrowed its gap with glass containers.

    Since the early period, paper and cardboard have been placed in the first position of materials that have been recycled approximately 65%. After it had a fall then reached its peak at four fifths in 1994, the proportion of paper and cardboard dropped gradually to seventy percent in the end of the period given. On the other hand, glass containers started with fifty percent then has a downward trend in 1986 and 1990. It grew moderately in 1994 and successfully back to the same amount of where it started.

    In terms of aluminium cans, the amount has increased significantly since its appearance. Starting with a very small number, the percentage of aluminium cans that are reprocessed has gradually increased to approximately nearly a half. The percentage of recycled materials made from plastics was raised overtime although it is obviously more stable than other materials. It accounted for around 2% in 1990 and ended by less than ten percent.

  6. Shuja says:

    The line graph depicts the percentage of materials recycled in a country over a period of three decades. It shows four different materials and the change in the percentage of each recycled.

    Among the shown materials, paper, and cardboard were the most recycled. The percentage of recycled paper and cardboard experienced a gradual small increase and then a minimal decrease in the starting. It then saw a significant increase after the year 1990, however, this was short lived as a slow but consistent downward trend set in.

    Glass containers were a close second in terms of percentage recycled. Although it saw a decreasing trend at the beginning, a substantial increase was imminent. The graph took on a positive turn and continued upward till the year 2010.

    Aluminum cans, on the other hand, started from a very low point but then experienced a meteoric rise in the percentage recycled. A sharp and consistent increase can be seen throughout the time period. It can also be reasonably inferred that if the adoption of recycling aluminum cans continues at this rate, it will soon overtake all other materials.

    The final material shown on the graph is plastic. Statistically speaking, it is insignificant in comparison to other materials. It starts off very low and shows little signs of growth in the given timeframe. Its line graph is flat and the percentage recycled never crosses 10 percent.

    Overall, there is a growing trend in recycling. Periodic fluctuation can be observed throughout, however, on average every material was recycled more by the end of the given timeframe than the start

Leave a Reply

Your email address will not be published. Required fields are marked *