Average Money Spent Per Customer On Various Types Of Sports Equipment
Sample report
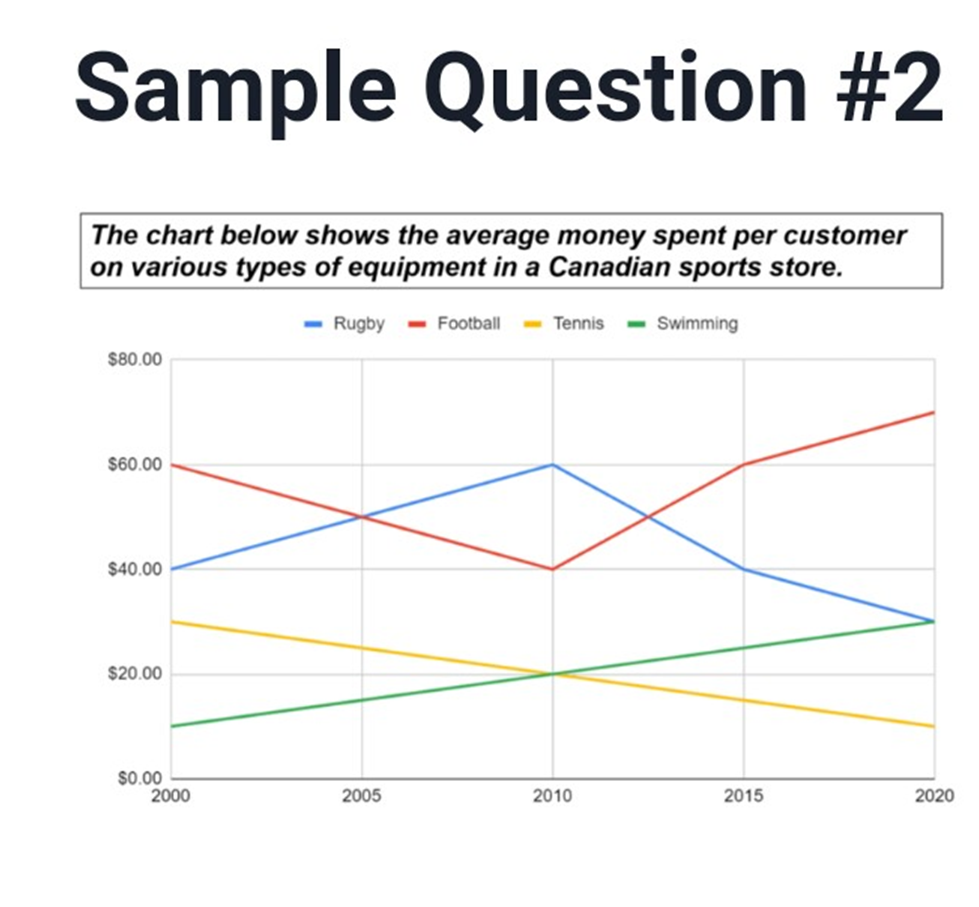
The line graph illustrates how much money shoppers spent on different types of sporting equipment at a sports shop in Canada. Overall, customer spending on football and swimming equipment increased by the end of the period, whereas spending on tennis and rugby decreased. Customer spending on football gear was the highest in 2000 at 60 USD/person. It decreased drastically over the next ten years and reached 40 USD/person in 2010. Afterwards, it increased significantly and by 2020, each customer was spending on average 70 USD on football equipment. Spending on swimming equipment was the lowest in 2000 at 10 USD/person but it increased steadily over the next 20 years and reached 30 USD/person in 2020. Although there was an increase of 20 dollars in the sale of rugby equipment between 2000 and 2010, sales of this sport equipment decreased from around $60 in 2010 to $32 in 2020. Sales of tennis equipment decreased throughout the given period from 30 USD/person in 2000 to 10 USD/person in 2020.
Need help with IELTS writing? Get your essays, letters and reports corrected by me.
