Average Carbon Dioxide Emissions Per Person In The UK, Sweden, Italy And Portugal
Here is a model answer.
Sample report
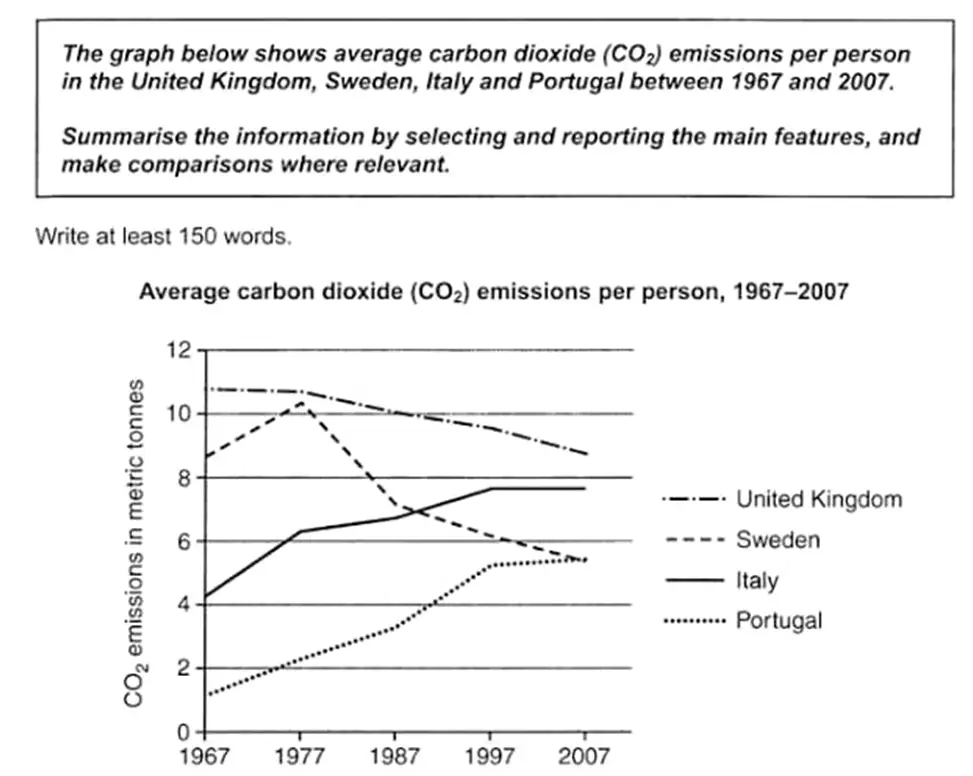
The line graph shows the per capita carbon dioxide emissions of four countries during the period between 1967 and 2007. Overall, it can be seen that the average per person carbon dioxide emission of the UK was higher than that of the other three countries throughout the given period although it dipped from 11 metric tonnes to about 9 metric tonnes over the 40 year period. Sweden was a major emitter of carbon dioxide until 1977. Afterwards, their emission levels fell drastically and in 2007, their per capita CO2 emission was a little over 5 metric tonnes which equalled that of Portugal. Portugal interestingly emitted the least amount of carbon dioxide in 1967 (1 metric tonne/person). It increased drastically over the years and peaked at over 5 metric tonnes in 2007. Italy was one of the lowest emitters of CO2 in 1967 (4 metric tonnes /person). However, their emission levels steadily increased and nearly doubled over the next 40 years.
Need help with IELTS writing? Get your essays, letters and reports corrected by me.