Average Household Expenditures In Japan And Malaysia In The Year 2010
Need help with IELTS writing? Get your reports, essays and letters corrected by me.
Sample report
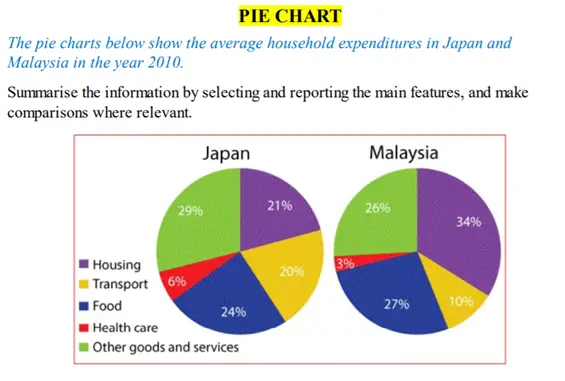
The given pie chart illustrates the expenses incurred by the Malaysians and the Japanese on different aspects of life. Overall, it can be seen that the Malaysians spent the most on housing whereas the Japanese spent the most on other goods and services. First of all, housing was the biggest expense for Malaysians in 2010. While they spent 34% of their income on housing, it was the third biggest cause of expenditure in Japan with families spending only 21% of their revenue on housing. Similarly, a significant difference can be observed in healthcare and transportation expenses as the Japanese spent (26%) two times as much as Malaysians on both aspects. On the other hand, the Japanese and the Malaysians spent more or less the same proportion of money on food and other goods and services and together these two sectors accounted for 53% of the total expenditure Malaysians and Japanese.