The Maps Show Changes That Took Place In Youngsville In Zealand | Task 1 Academic IELTS Report Sample
The maps show changes that took place in Youngsville in New Zealand over a 25 year period from 1980 to 2005.
Here is a model report on this report. Need help with IELTS writing? Get your IELTS essays, reports and letters corrected by me.
Task 1 Academic IELTS report sample
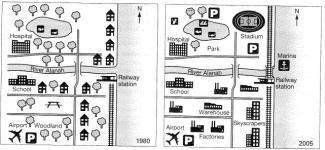
The maps give information about the landscape changes that occurred in Youngsville, New Zealand in the span of 25 years from 1980 to 2005. Overall, it is clear that the majority of the landed houses and greeneries were removed to make way for commercial and residential buildings such as factories, warehouses and skyscrapers throughout the 25-year duration.
First of all, a new stadium and car park were built on the Northern side of the hospital. The majority of the trees were removed around the hospital to build a park with facilities such as golfing, fishing and swimming. In 1980, the houses and trees near the school were replaced by warehouses. Also, in order to accommodate the growing population, most of the landed houses had been demolished / were demolished and replaced by skyscrapers by 2005.
The extension of railway can be observed in 2005 and the railway was extended all the way up to the north direction, next to the newly constructed stadium and parking space. In addition, the railway was extended up to north reaching as far as the stadium. Last but not least, a new marina was built next to the railway station.
More Task 1 Academic Report Samples
- The pie charts show the results of a survey in which undergraduates and postgraduates were asked about the range of books in their library
- The diagram shows the lifecycle of a species of large fish called salmon
- The maps show road access to a city hospital in 2007 and 2010
- Line graph shows the consumption of three different types of fast food in Britain
- Average household expenditures in Japan and Malaysia in the year 2010
- The graph shows the proportion of four different materials that were recycled from 1982 to 2010
- IELTS report about development of a village
- The graph shows the number of university graduates in Canada from 1992 to 2007
- Chart shows the percentage of Australian men and women in different age groups who did regular physical activity