The Charts Show The Average Percentages In Typical Meals Of Three Types Of Nutrients | Task 1 IELTS Report Sample
The charts below show the average percentages in typical meals of three types of nutrients, all of which may be unhealthy if eaten too much.
Summarize the information by selecting and reporting the main features, and make comparisons where relevant.
You should write at least 150 words.
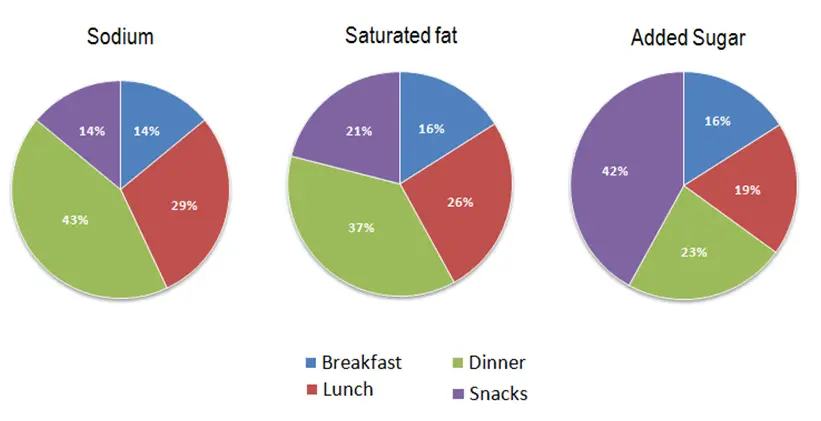
Average percentages of sodium, saturated fats and added sugars in typical meals consumed in the USA.
Here is a band 8 report on this topic. Need help with IELTS writing? Get your IELTS essays, letters and reports corrected by me.
Task 1 Academic IELTS Report Sample
The given pie charts show the amount of unhealthy ingredients like sodium, saturated fat and added sugar in four meals of the day consumed in the US. Overall, it can be seen that breakfast is the healthiest meal of the day as it contains the least amount of these three ingredients whereas dinner is the unhealthiest meal of the day. Of the four meals of the day, dinner has the highest amount of sodium and saturated fat at 43% and 37% respectively. Lunch has the second highest percentage of sodium and saturated fat at 29% and 26%. Added sugar was the highest in snacks at 42%. Lunch had 29% of sugar, 26% of saturated fat and 19% of added sugar. Breakfast had 14% of sodium, 16% of saturated fat and added sugar. Snacks had 42% of sugar, 21% of saturated fat and 14% of sodium. Dinner had 43% of sugar, 37% of saturated fat and 23% of added sugar.
Quick Links