The Chart Shows Air Pollution Levels By Different Causes Among Four Countries
Sample report
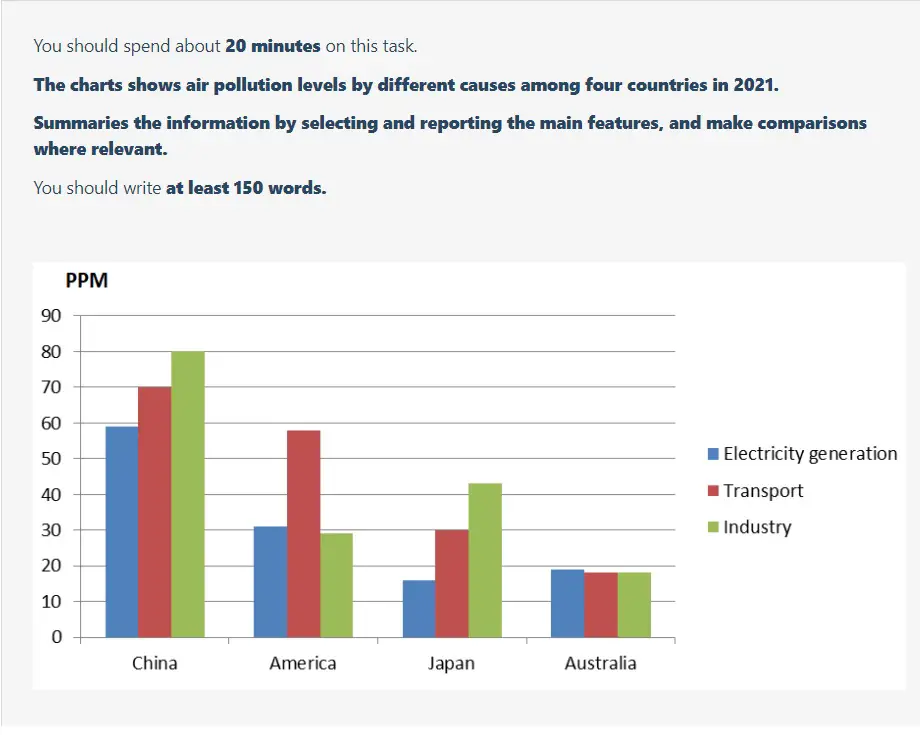
The bar chart shows the different factors that contributed to air pollution in China, America, Japan and Australia in the year 2021. Overall, it can be seen from the graph that China is the most polluted country among the four whereas Australia has the lowest levels of air pollution. In China, power production, transport and industry caused 60 PPM, 70 PPM and 80 PPM levels of pollution respectively. In America, transport causes the maximum air pollution of around 58ppm whereas the other two sectors cause considerably less pollution (around 30PPM each). America is also the second most polluted country in the list. In Japan, the trend is similar to that of China with power generation causing the least (18PPM) and industries causing the most (42PPM) air pollution. Transport causes about 30 PPM pollution in Japan. Australia is the least polluted country and all the aforementioned factors cause almost similar levels of pollution at around 20 PPM.
Need help with IELTS writing? Get your essays, letters and reports corrected by me.