The Chart Gives Information About How Families In One Country Spent Their Weekly Income In 1968 And 2018
Sample report
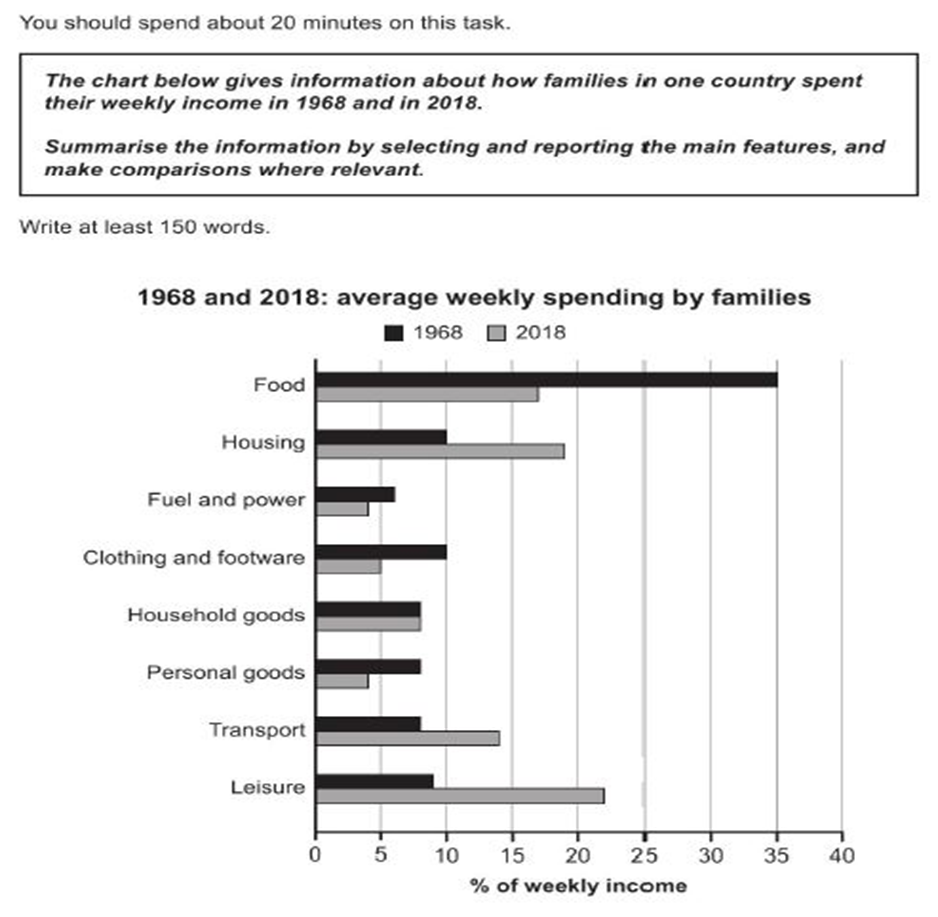
The bar chart shows the proportion of weekly income that families spent on various essential goods and services in the years 1968 and 2018. Overall, it can be seen that in 1968, families spent the most on food and the least on fuel and power, whereas in 2018, the spending on leisure was the highest. In both years, they spent the least on fuel and power (6% and 4% respectively). In 1968, families spent as much as 35% of the weekly income on food. Housing and clothing and footwear were the second biggest expenses. They spent 10% on each of them. Money expended on household goods, personal goods and transport was the same (8% each) in 1968 and they spent slightly more on leisure. By 2018, leisure had become the biggest expense and totaled to 22% of the weekly income. Housing was the next and families spent nearly 19% of their income on this. They also spent a considerable proportion of their income (14%) on transport. While the spending on household goods remained the same in both years, in 2018, expense related to clothing and footwear and personal goods nearly halved.
Need help with IELTS writing? Get your essays, letters and reports corrected by me.