The Bar Chart Shows The Hours Per Week That Teenagers In Chester Spent Doing Certain Activities
Need help with IELTS writing? Get your essays, letters and reports corrected by me.
Sample report
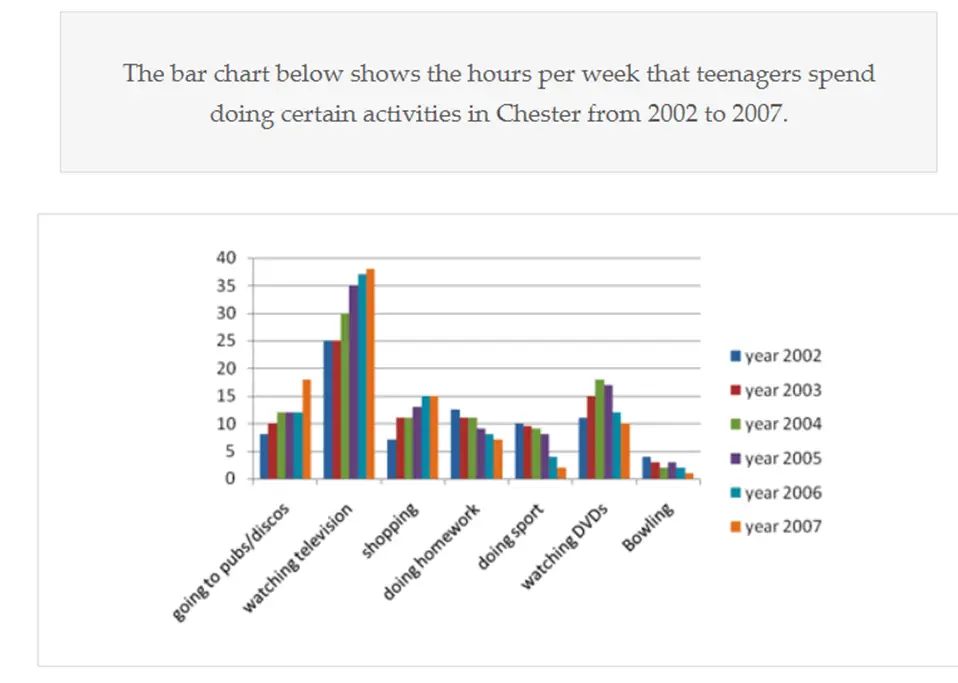
The bar chart shows the amount of time that teenagers in Chester spent doing various activities during the period from 2002 to 2007. It can be seen that in all the years, watching television was the most popular activity among Chester teenagers. While they spent 25 hours/week for watching television in 2002, this number rose to 38 hours/week in 2007. The other popular activities were shopping and watching DVDs; however, they were not even half as popular as watching TV. In 2002, teenagers spent barely 7 hours/week for shopping. Over the next few years, the time spent for shopping increased and in 2007 on average they spent 15 hours/week on this activity. The hours spent for watching DVDs continuously increased from 11 hours/week in 2002 to 17 hours/week in 2004. Then its popularity declined and in 2007 teenagers spent only 10 hours/week for watching DVDs. Homework consumed several hours of teenagers in 2002. While they spent 13 hours/week on homework in 2002, it nearly halved to 7 hours/week in 2007. By contrast, the number of hours/week spent in pubs/discos increased from 8 in 2002 to 18 in 2007. Hours spent doing sport declined from 10 in 2002 to 2 in 2007. Bowling was the least popular activity in all the years and the amount of time that teenagers spent on bowling continually declined during the given time frame.
See also