Trends In Tea And Coffee Consumption | Task 1 Academic IELTS Report Sample
Sample report
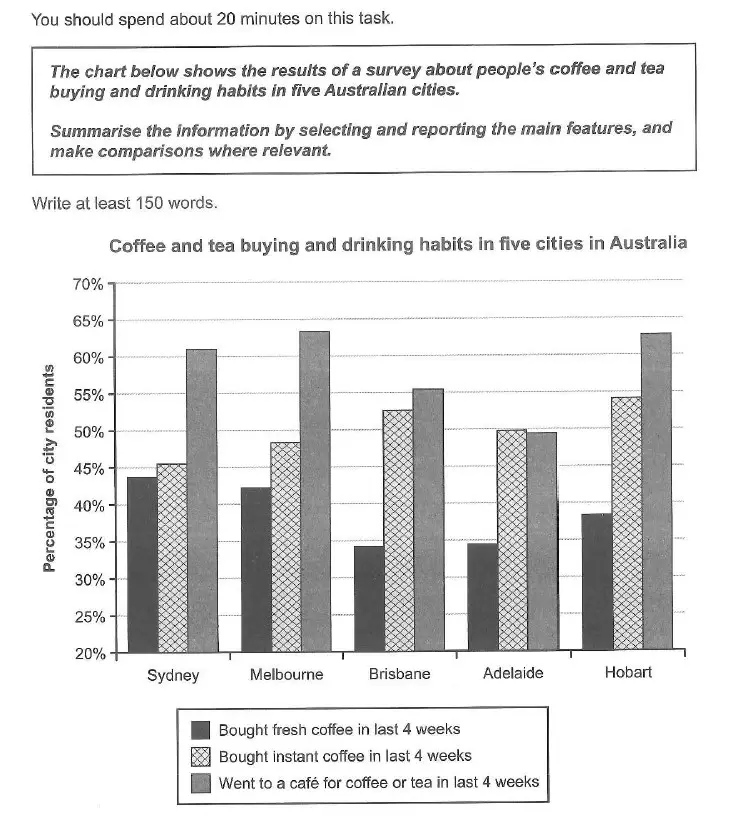
The given bar chart shows the trends in tea and coffee consumption in five Australian cities over a period of four weeks. It is evident that in all cities except Brisbane and Adelaide, the percentage of people who went to a cafe for tea or coffee was significantly higher than those who bought fresh or instant coffee. While in Brisbane, it was only slightly higher than the percentage of people who bought instant coffee, in Adelaide, it was actually lower than the proportion of people who drank instant coffee. In all the five cities, the practice of buying fresh coffee was not as popular as the practice of buying instant coffee or visiting a cafe. While Brisbane and Adelaide had the lowest proportion of people who bought fresh coffee (less than 35%), Sydney had the highest percentage of them at about 45%. Instant coffee was more popular in Brisbane and Hobart where between 55% and 60% of the population consumed it. In the other cities also it was considerably more popular than fresh coffee.
Need help with IELTS writing? Get your essays, letters and reports corrected by me.