Number Of Books Borrowed From Four Libraries
Here is a sample answer for this topic. Need help with IELTS writing? Get your writing samples corrected by me.
Sample report
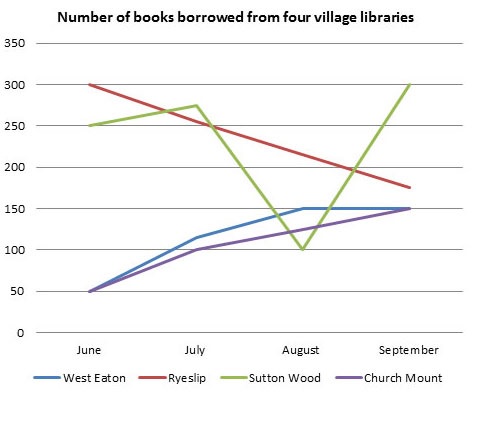
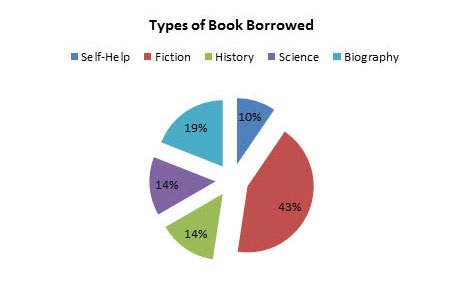
The line graph shows the number of books borrowed from four libraries in the months of June, July, August and September of 2014. The pie chart shows the percentage wise data of the different types of books that were borrowed.
Overall, it can be seen that the libraries of RyeSlip and Sutton Wood lent the highest number of books during the given period. Ryeslip library lent the highest number of books (300) in the month of June followed by Sutton Wood library which lent 250 books during the same month. Over the next 3 months, there was a dramatic decline in the number of books borrowed from Ryeslip library. Actually in September only about 175 books were borrowed from this library. The number of books borrowed from Sutton Wood library increased to 275 in July but in August it fell sharply to 100. Despite this, in September this library had the highest number of borrowings (300 books). Over the given period, there was a consistent increase in the number of books borrowed from West Eaton and Church Mount libraries. Both of them lent only 50 books in June. Over the next three months, the number of borrowings increased more for West Eaton than for Church Mount. However, in September, both of them lent 150 books.
As for the types of books, 43% of the total books borrowed belonged to the category of fiction. Biographies were the second most popular and accounted for 19% of the total borrowings. Together history (14%), science (14%) and self help (10%) accounted for 38% of the borrowings.