Local Government Expenditure In 2010 And 2015

Here is a sample report on this topic. Need help with IELTS writing? Get your essays, letters and reports corrected by me.
Sample report
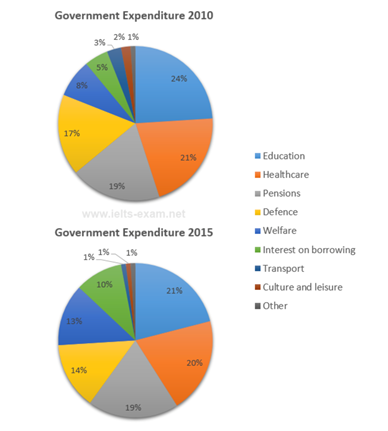
The pie charts compare local government expenditure in two years – 2010 and 2015. Overall, it can be seen that in both the years education, healthcare, pensions and defense were the biggest expenditures for the government. Meanwhile spending on transport, culture and leisure and other were negligible. While the local government spent 24% of its budget on education in 2010, this spending reduced by 3% over the next five years. The spending on healthcare decreased from 21% in 2010 to 20% in 2015 whereas the spending on pensions remained the same (19%) in both the years. Defense spending decreased from 17% in 2010 to 14% in 2015. The spending on both welfare and interest on borrowings increased by 5% over the given period. While in 2010, transport, culture and leisure and other sectors together accounted for 6% of the total spending, in 2015 only 3% of the total budget was spent on these sectors.