Chart Shows The Percentage Of Australian Men And Women In Different Age Groups Who Did Regular Physical Activity
Sample report
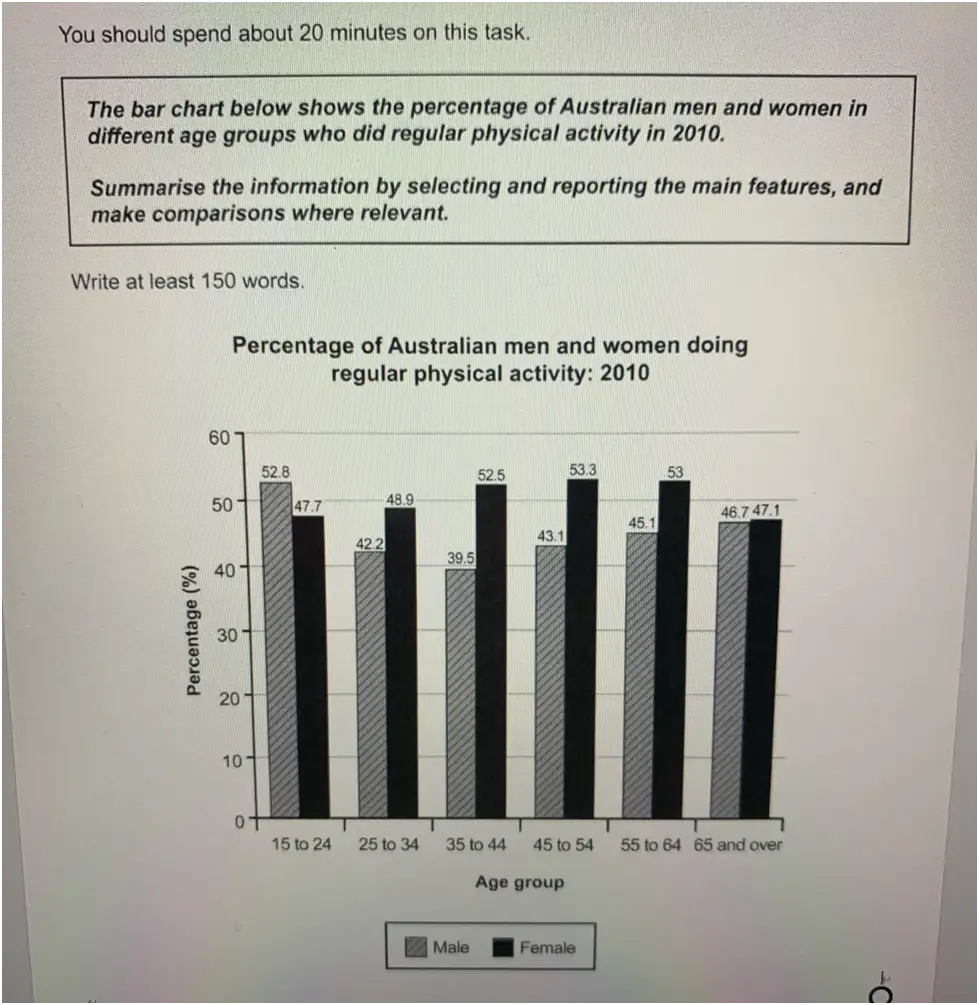
The bar chart illustrates the percentage of Australian men and women belonging to different age ranges who performed regular physical activity in 2010. Overall, women were considerably more physically active than men.
More men than women exercised among those aged between 15 and 24. While 52.8% of men belonging to this age bracket exercised regularly, the corresponding figure for women was 47.7%. As men grew older, they also tended to become less physically active. The least physically active men belonged to the 35-44 age group. Only 39.5% of them exercised regularly. Interestingly as much as 52.5% of women of this age group were physically active. The proportion of physically active men were higher among those aged 45 and over. The prevalence of physical activity was the highest among women in the 45 to 54 age group. As much as 53.3% of them exercised regularly. The proportion of physically active women was only slightly lower among the 55 to 64 age group at 53%. Among seniors (65 and over) there was not much difference in the percentage of physically active men and women. 46.7% of senior men and 47.1% of senior women engaged in regular physical activity.
Need help with IELTS writing? Get your essays, letters and reports corrected by me.