Stock Price of Four Technology Companies | Band 9 Report

Sample report
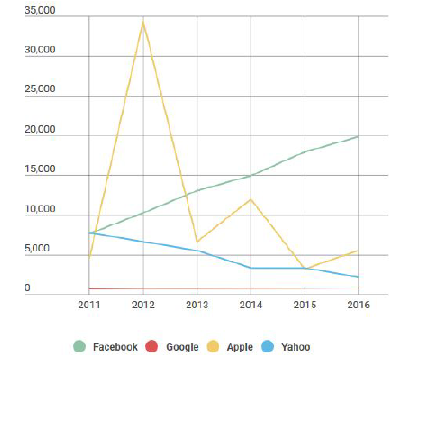
The line chart displays information about the stock price / stock value of four different companies during the five years from 2011 to 2016. Overall, four different trends are visible. While the stock price/value of Facebook increased dramatically over the five years, that of Yahoo decreased. There was no variation in the stock value of Google during the entire five years but Apple stocks underwent drastic price fluctuations.
The most striking point is that in 2011, Apple stocks were the second least expensive after Google stocks, but a year later its stocks were by far the most expensive at 35,000 dollars. Its stock price fluctuated dramatically over the next few years and reached a low in 2015 with prices hovering around 4,000 dollars; however, the prices increased slightly during the next year and reached approximately 6,000 dollars in 2016.
As can be seen from the graph, the stock price of Facebook and Yahoo followed the opposite patterns between 2011 and 2016. While Facebook’s stock prices rose from roughly 7,000 in 2011 to 20,000 in 2016, the stock price of Yahoo dropped from 7,000 to 3,000 during the same period. As for the stock of Google, its price was the lowest at 2,000 and it remained stable during the entire five year period.