Amount Of Goods Transported In the UK | Band 7.5 Academic IELTS Task 1 Report
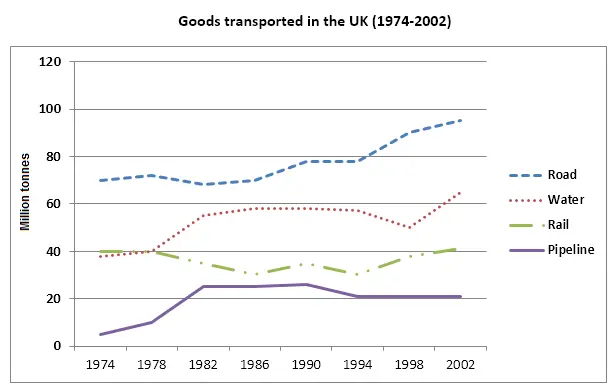
The graph below shows the quantities of goods transported in the UK between 1974 and 2002 by four different modes of transport.
Here is a sample IELTS report on this topic submitted by one of our students. Need help with writing? Get your writing samples corrected by me.
IELTS report sample

The line graph shows the quantity of goods transported by four different means of transportation in the UK during the period between 1974 and 2002. It can be seen that roadways remained the most popular throughout the given period. In 1974, about 70 million tonnes of goods were transported by roadways. This quantity slightly increased, and then slightly decreased before increasing again until 1994. Afterwards, it grew steadily to reach 95 million tonnes in 2002. Waterways were the second most widely used means of transportation for goods. In 1974, 40 million tonnes of goods were transported by waterways. This increased to approximately 55 million tonnes by 1982 and then remained more or less unchanged until 1994. Afterwards, it dropped and then increased again. In year 2002, about 65 million tonnes of goods were transported by waterways. The quantity of goods transported by railways fluctuated during the given period though it was approximately the same at the beginning and at the end (40 million tonnes). Pipeline was the least commonly used means of transport for goods. While only about 5 million tonnes of goods were transported by pipeline in 1974, it increased to about 25 million tonnes during the period between 1982 and 1990. Afterwards it dropped slightly and in 2002, it transported 20 million tonnes of goods.