IELTS Task 1 Report About Amount Of Money That US Charity Spent And Received
Sample report
Sample report
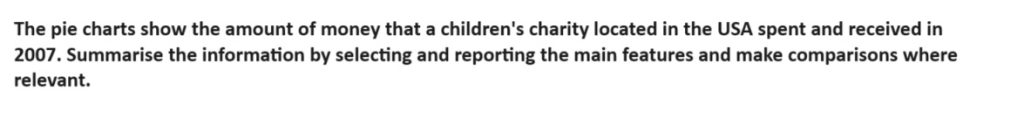
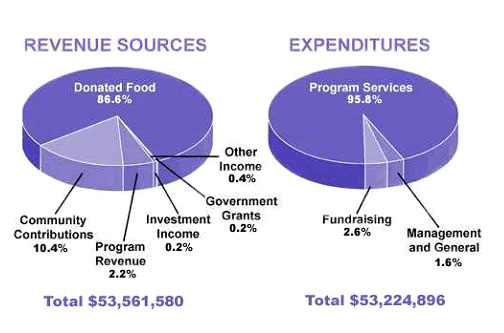
The given pie charts show information regarding the revenue and expenditure of an American children’s charity in 2016. Overall it can be seen that the total revenue was slightly higher than the total expenditure. Donated food was the highest source of revenue whereas program services were the biggest expenditure.
As per the chart, donated food contributed to 86.6% of the total revenue. Community contributions were the second highest source of revenue and they accounted for 10.4% of the total revenue. Program revenue accounted for 2.2% of the total income, while the other three sources together contributed less than 1% of the total revenue.
As for the expenses, the highest amount of money was spent on program services. Actually, the expenditure on this item was 95.8% of the total income. Fundraising was the second biggest expenditure and used up 2.6% of the revenue. Only 1.6% of the funds were used for general and management expenses.
Do you have a report on this topic? Submit it below in the comments for a free band score estimate.